|
Listen to the Article
|
As a marketer, you know that data is essential to your success. But sifting through mountains of data can be time-consuming and overwhelming. That’s where visualization tools come in.
Visualization tools take data and present it in a way that is easy to understand and interpret. This can help you identify patterns and trends, and make better-informed decisions about your marketing campaigns.
There are a number of different visualization tools available, and the right tool for you will depend on your specific needs. To help you get started, we’ve compiled a list of the top 5 visualization tools for powering your marketing data:
1. Tableau
Tableau is a powerful data visualization tool that can help you see and understand your data like never before. With Tableau, you can easily create stunning visualizations and dashboards that help you see the big picture and spot trends and patterns.
2. Google Charts
Google Charts is a free, easy-to-use visualization tool that is perfect for getting started with data visualization. With Google Charts, you can create a variety of different charts and graphs, including bar charts, line charts, and pie charts.
3. Microsoft Excel
Microsoft Excel is a widely used spreadsheet application that can also be used for data visualization. Excel offers a number of different chart types that you can use to visualize your data, including bar charts, line charts, and scatter plots.
4. R
R is a programming language that is popular among data scientists and statisticians. While it may take some time to learn how to use R, it offers a powerful set of tools for data visualization. With R, you can create highly customized visualizations that can help you uncover deep insights into your data.
5. Python
Python is another popular programming language that is often used for data visualization. Like R, Python offers a wide range of powerful tools for creating custom visualizations. Python is also relatively easy to learn, making it a great choice for those who are new to data visualization.
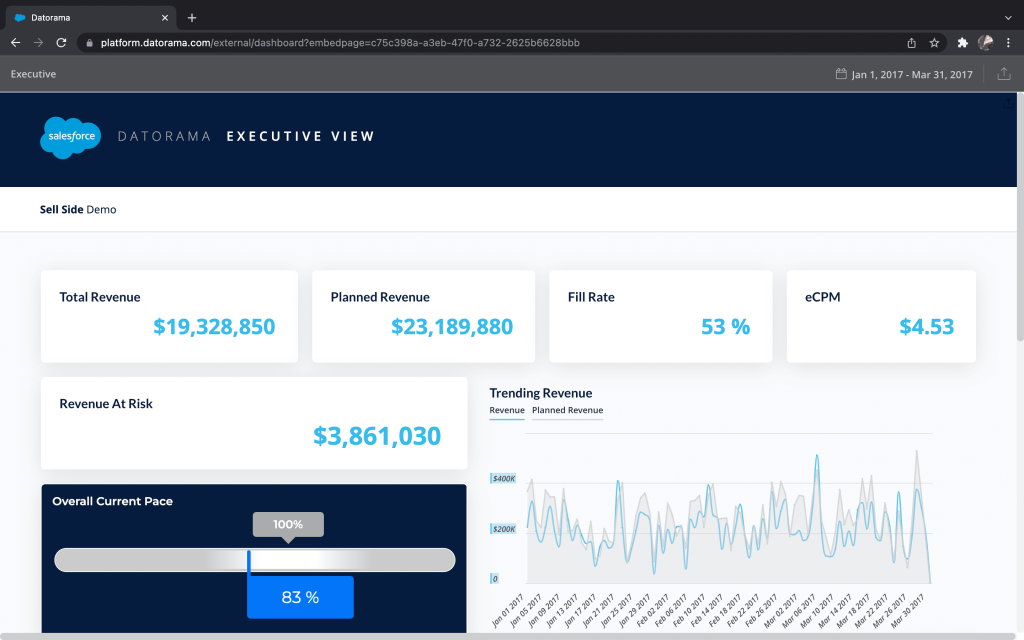
6.Datorama
With Datorama you can connect all your marketing data to a single source of reliable and intelligent information for end-to-end reporting, measurement and optimization.